Welcome to all Riverside South residents and real estate enthusiasts! We’re thrilled to bring you up to speed with the latest data-driven insights and trends from our February 2024 Riverside South real estate market report. From property prices to days to sell, we’re serving up each juicy statistic for your review and consideration, all in an attempt to keep you informed about the current state of the unique housing market in Riverside South.

Property Prices
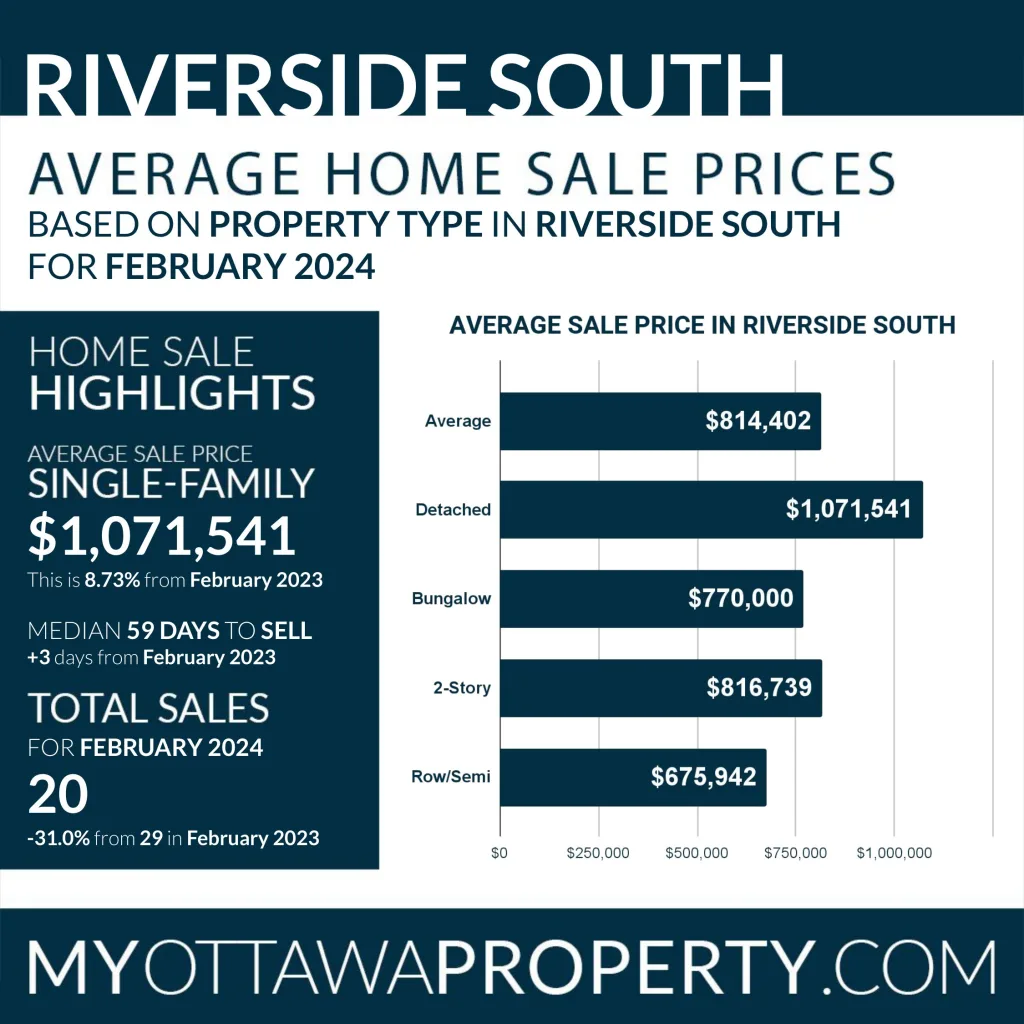
Looking at the tale of numbers for detached single-family homes, a figure leaps right off the page. In February 2024, the average sales price for this property type in Riverside South was $1,071,541. This shows a considerable 8.73% surge when contrasted with last year’s price of $985,533 in February 2023.
Days to Sell
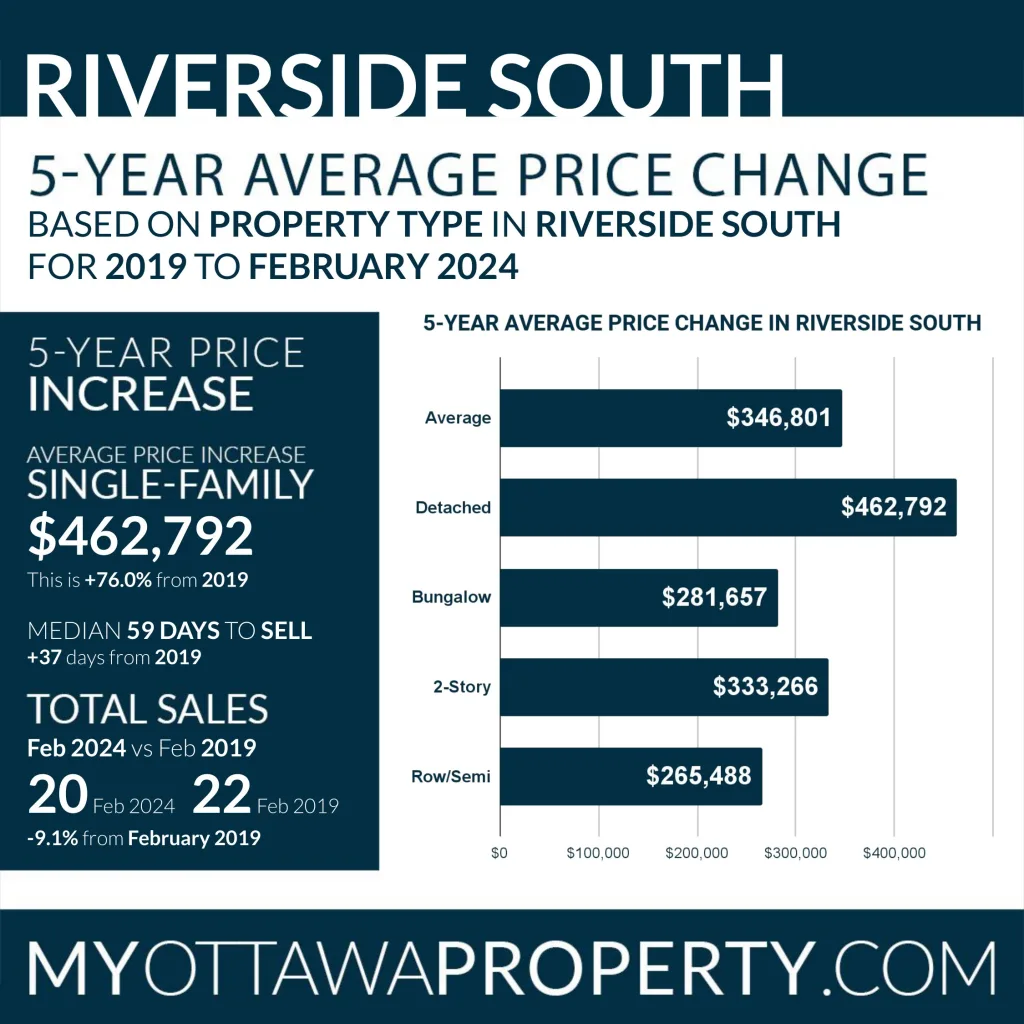
Our data shows that, on average, properties spent 59 days on the market in Riverside South in February 2024. This represents a minor increase of +3 days, compared to February 2023. If you take a broader view, you will notice that the average Days to Sell has risen significantly, with a +37 day jump compared to five years ago when it was only 22 days in February 2019.
Properties Sold
Let’s talk transactions! In February 2024, the housing market in Riverside South saw 20 properties change hands. This marks a significant decrease of -31.0% when measured against the 29 properties sold in the same month of the previous year. Five years back, in February 2019, we saw 22 properties sold, denoting a decrease of -9.1% from last month’s figure.
Long-Term Market Growth
Over the span of the last five years (2019 to 2024), the average sale prices for detached homes in Riverside South have remarkably ballooned from $608,750 to a whopping $1,071,541. This leap represents an average growth of +3.9%, which implies an average equity increase of approximately $462,792. Looking at specific types of properties, bungalows have seen a +57.7% increase, 2-story homes a staggering +68.9%, and row/town homes a +64.7%, all well above the overall market growth.
Riverside South vs Ottawa
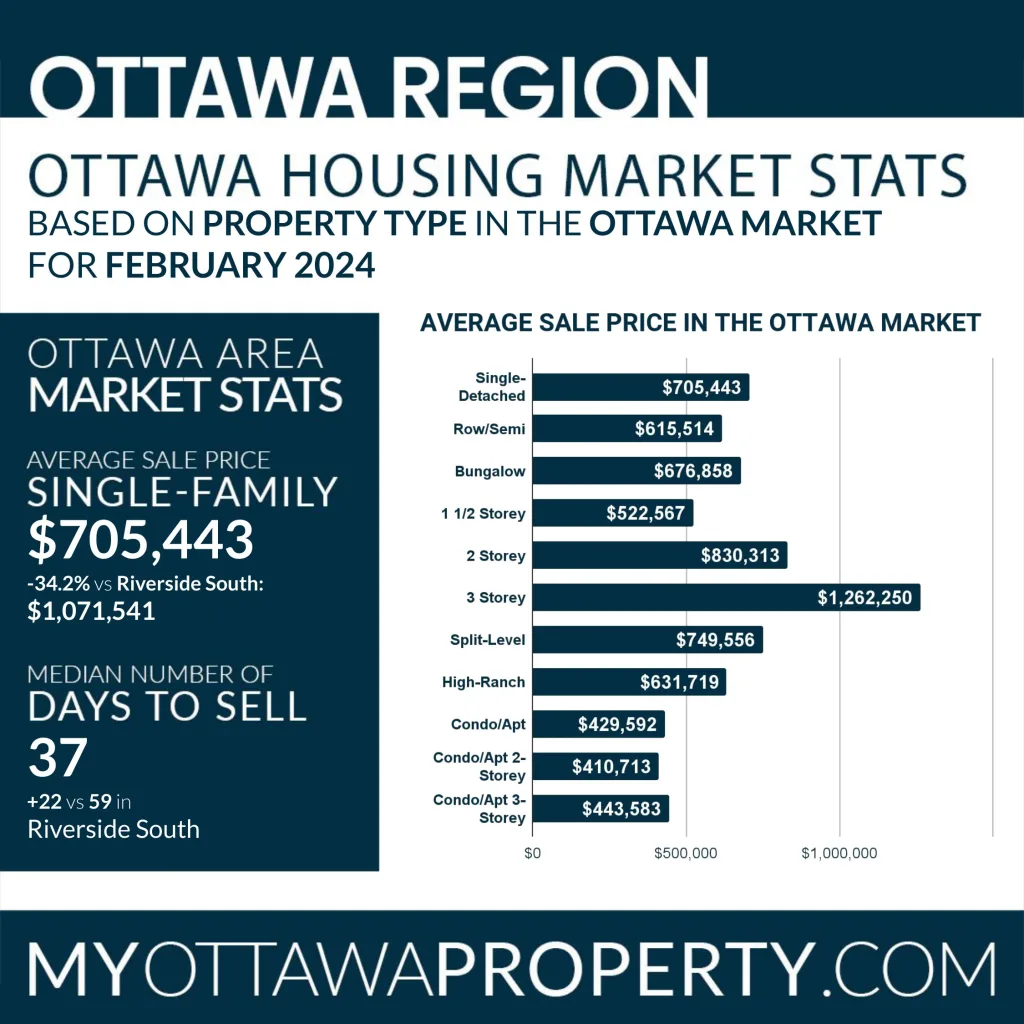
Zooming out to pit Riverside South against the broader municipality of Ottawa, some interesting trends come to light. In February 2024, the average sale price of a detached single-family home in Ottawa stood at around $705,443. Set against Riverside South’s average home price $1,071,541, Ottawa trails by -34.2%.
Posted Mortgage Rates
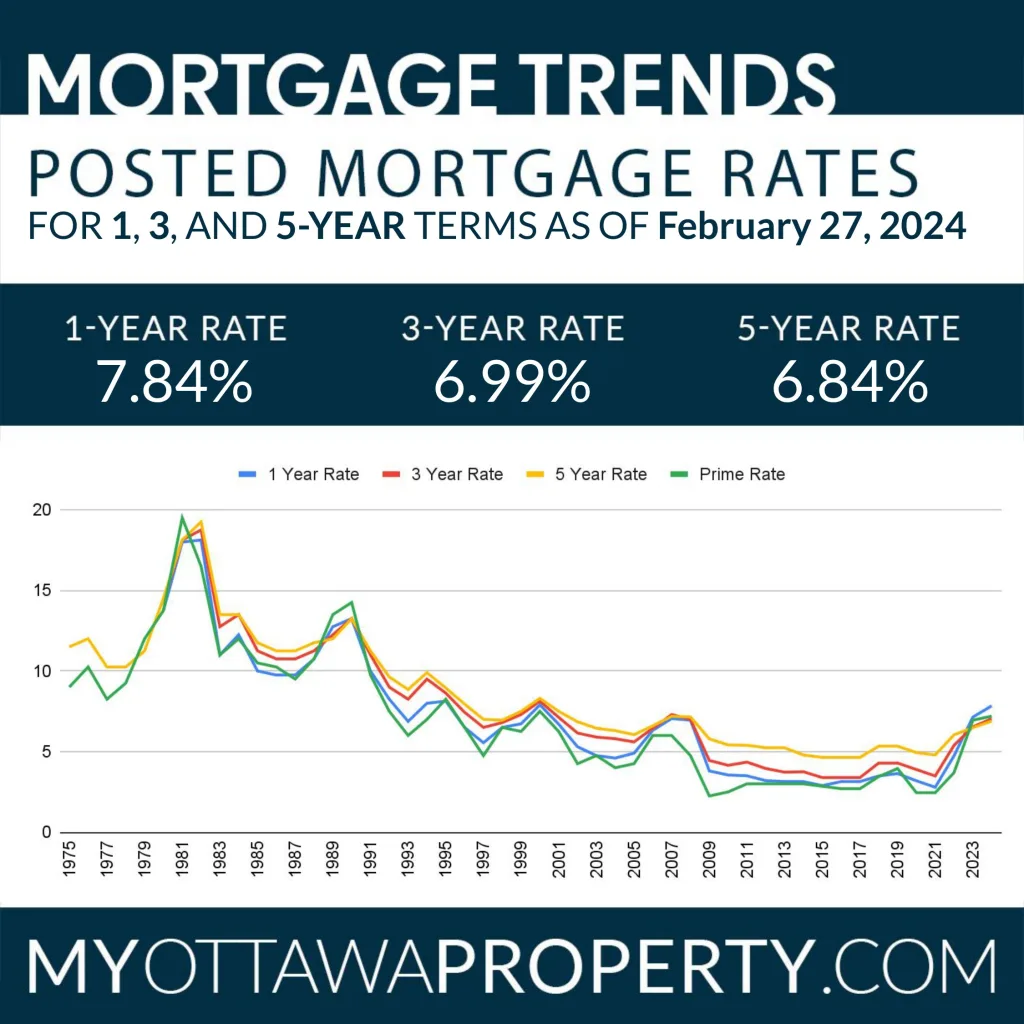
As of the end of February 27, 2024, the interest rates on fixed-term mortgages stand at 7.84% for a 1-Year term, 6.99% for a 3-Year term, and 6.84% for a 5-Year term. These rates will undeniably play a role in decision-making for both buyers and sellers.
Conclusion
The February 2024 Riverside South real estate market report paints a vivid picture of a dynamic housing landscape. With property prices surging and days to sell showing slight increases, residents and enthusiasts alike are wise to stay informed about these trends. While transaction volumes may have dipped, long-term growth remains robust, with significant equity gains across property types. Moreover, when comparing Riverside South to Ottawa at large, it’s evident that the local market boasts considerable premiums. As we navigate through changing mortgage rates, it’s clear that they will continue to influence the decisions of buyers and sellers alike, shaping the trajectory of the Riverside South real estate market in the coming months.

All real estate statistics have been obtained from data reported by the Ottawa Real Estate Board’s MLS System. We have curated our search criteria to ensure more accurate stats for smaller regions of Ottawa. All figures are believed accurate but may not be guaranteed – we are human after all!