Welcome to all Richmond residents and real estate enthusiasts! We’re thrilled to present the latest Richmond real estate market report for February 2024. In this month’s report we delve into the key statistics that will keep you informed about the current state of the unique housing market in Richmond.

Property Prices
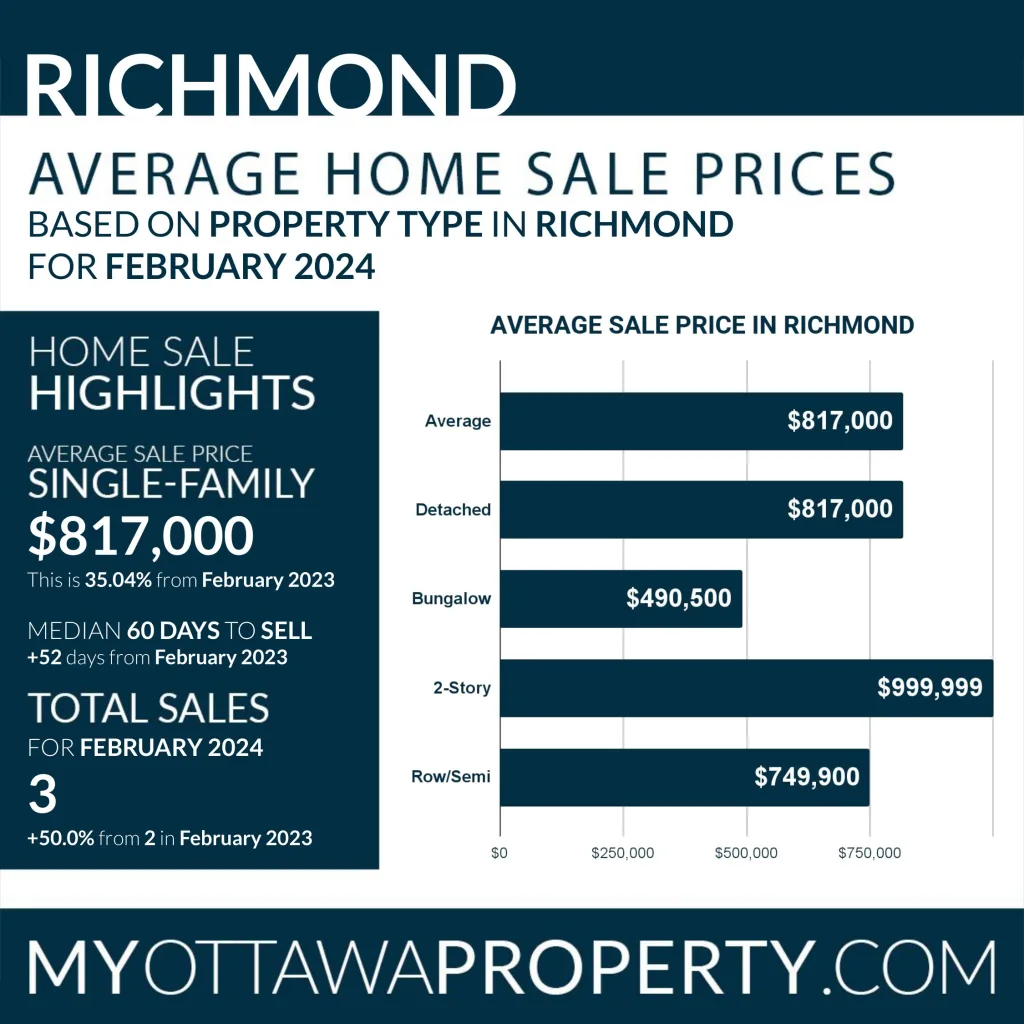
The average sale price for a detached single-family home in February 2024 for Richmond has been recorded at $817,000, which reflects a 35.04% increase compared to last year’s price of $605,000 for February 2023. This significant rise in price reflects a strong sellers’ market with high demand for properties in the area.
Days to Sell
The average time on the market in Richmond for February was 60 days, representing +52 days from last year in February 2023. The average Days to Sell in February 2024 was 60. Compared to 5 years ago in February 2019, the average Days to Sell was 49, a difference of +11 days. This suggests that while properties are becoming more attractive to buyers, they are spending a slightly longer time on the market than in previous years.
Properties Sold
In February 2024 there were 3 properties sold. Last year, in February 2024, there were 2 properties sold, a difference of +50.0%. 5 years ago, in February 2019, there were 1 properties sold, a difference of +200.0% from February 2024. A substantial increase in property sales indicates a highly active market with robust seller activity.
Long-Term Market Growth
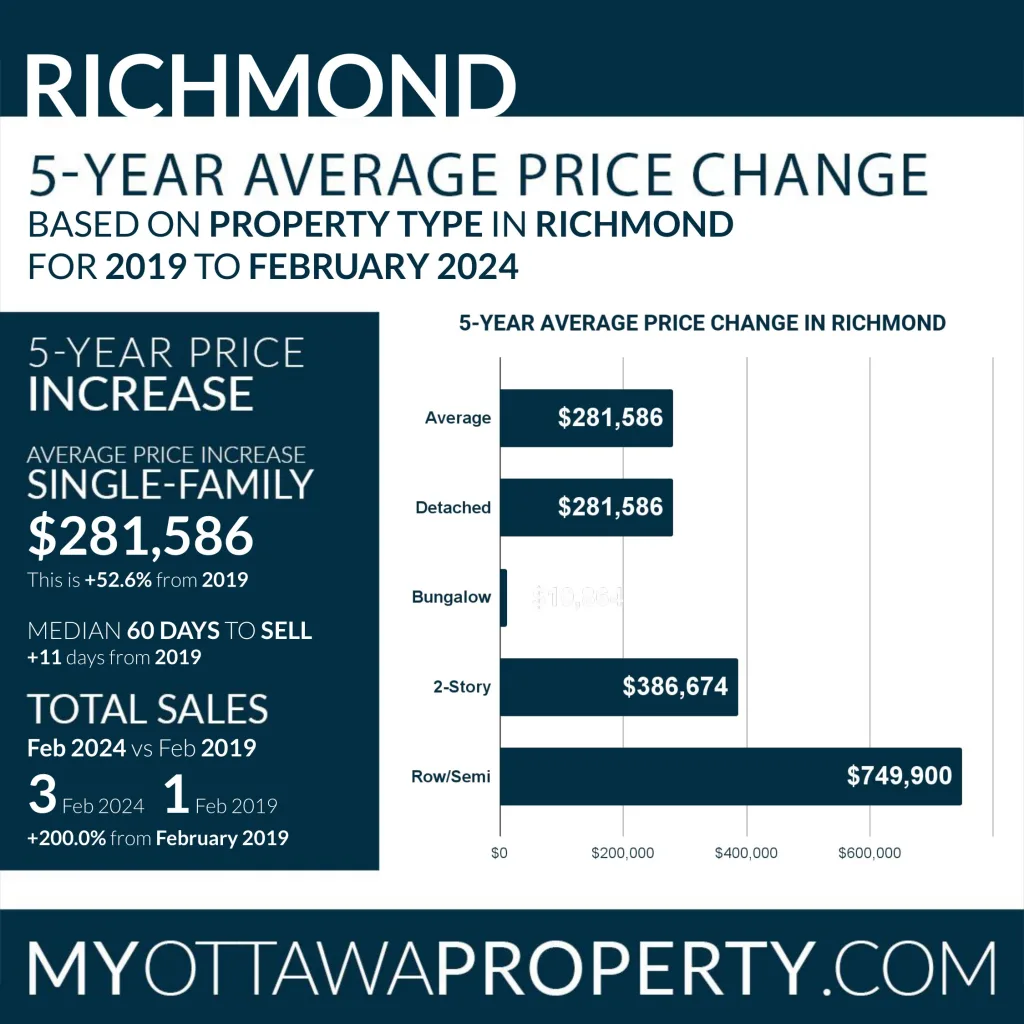
In the last 5 years, sale prices for detached homes in Richmond have gone from an average of $535,413 in 2019 to the current average sales price of $817,000 in February 2024. This reflects an average difference of +12.0%, representing an average equity increase of approximately $281,586 for detached single-family homes in Richmond.
To break this down further, the average sales price change for a Bungalow from 2019 to February 2024 is $10,864, a difference of +2.3%. The average sales price change for a 2-Story home from 2019 to February 2024 is $386,674, a difference of +63.0%. The average sales price change for a Row/Town home from 2019 to February 2024 is $749,900, a difference of N/A. This breakdown paints a picture of diverse gains across property types.
Richmond vs Ottawa
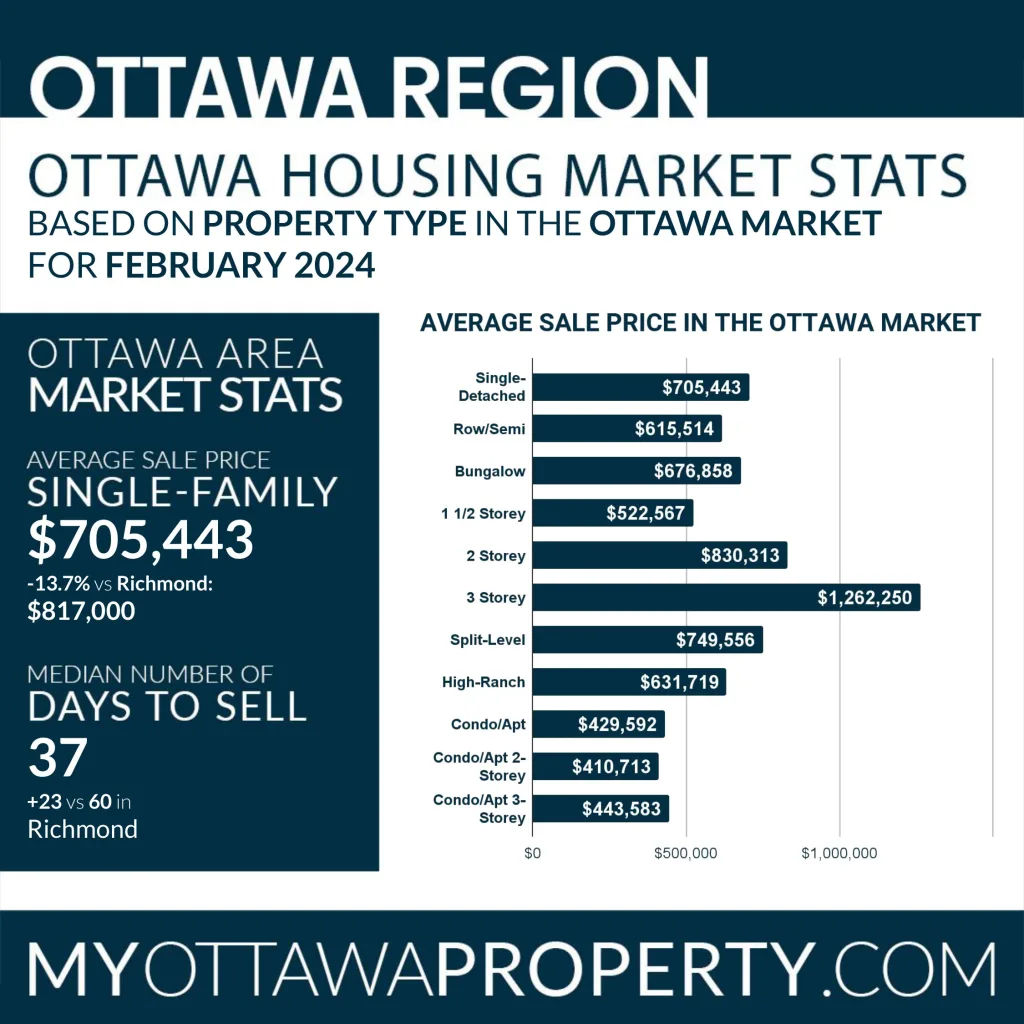
Comparing Richmond to the broader municipality of Ottawa, we find fascinating trends emerging. In February 2024 the average sale price for a detached single-family home in the municipality of Ottawa was around $705,443. This is -13.7% compared to Richmond’s average single-family home price of $817,000. This contrast demonstrates the premium placed on Richmond properties compared to the larger Ottawa area.
Posted Mortgage Rates
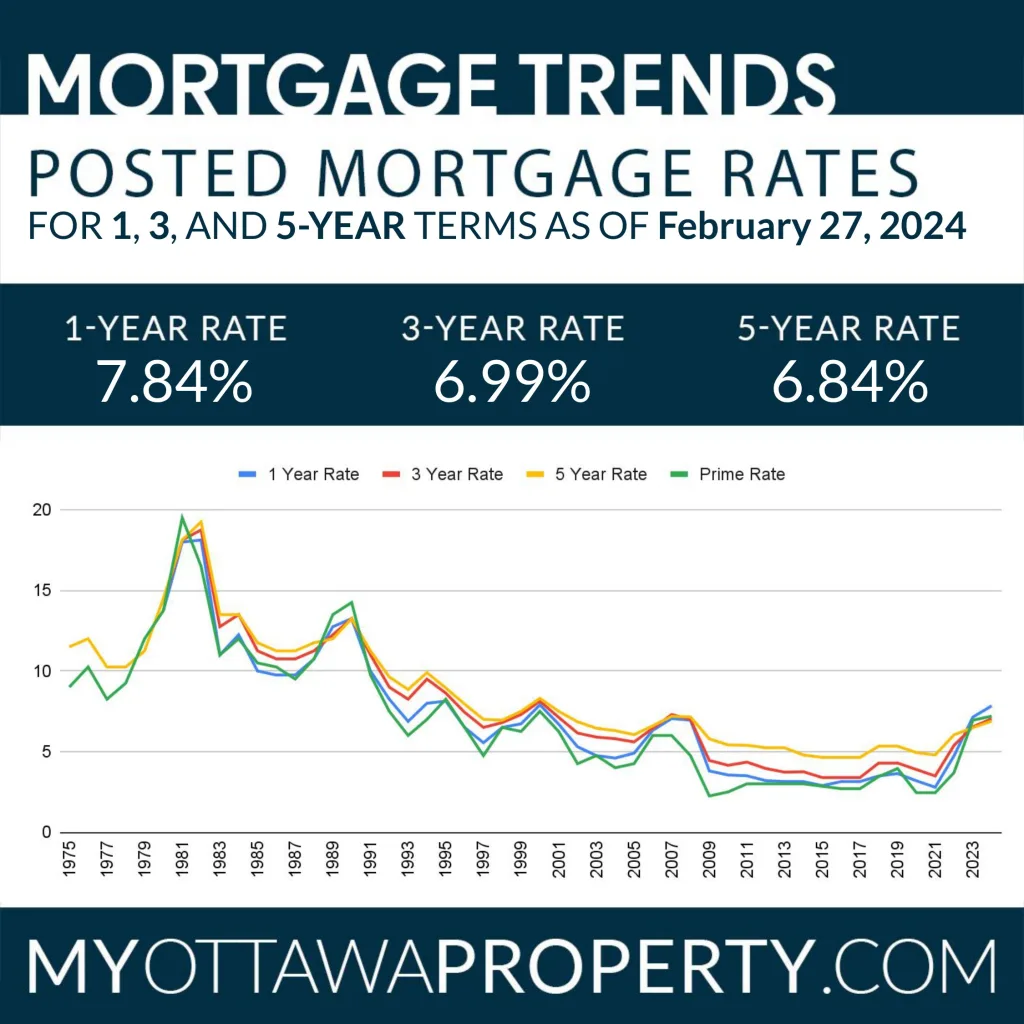
As of February 27, 2024, the interest rates for a 1-Year term is 7.84%, the 3-Year term is 6.99%, and the 5-Year term is 6.84%. In the backdrop of rising property prices, these competitive rates can provide prospective buyers the much-needed financial relief.
Conclusion
The Richmond real estate market in February 2024 continues to showcase remarkable growth and activity, with property prices soaring and sales remaining robust. Despite a slight increase in the average time properties spend on the market, the demand remains high, reflecting a strong sellers’ market. Furthermore, the comparison between Richmond and Ottawa highlights the premium placed on Richmond properties. With competitive mortgage rates providing financial relief to prospective buyers, the future of Richmond’s real estate market looks promising.

All real estate statistics have been obtained from data reported by the Ottawa Real Estate Board’s MLS System. We have curated our search criteria to ensure more accurate stats for smaller regions of Ottawa. All figures are believed accurate but may not be guaranteed – we are human after all!