Welcome to all Findlay Creek residents and real estate enthusiasts! We’re thrilled to present the latest Findlay Creek real estate market report for September 2023. In this month’s report, we delve into the key statistics that will keep you informed about the current state of the unique housing market in Findlay Creek.

Property Prices
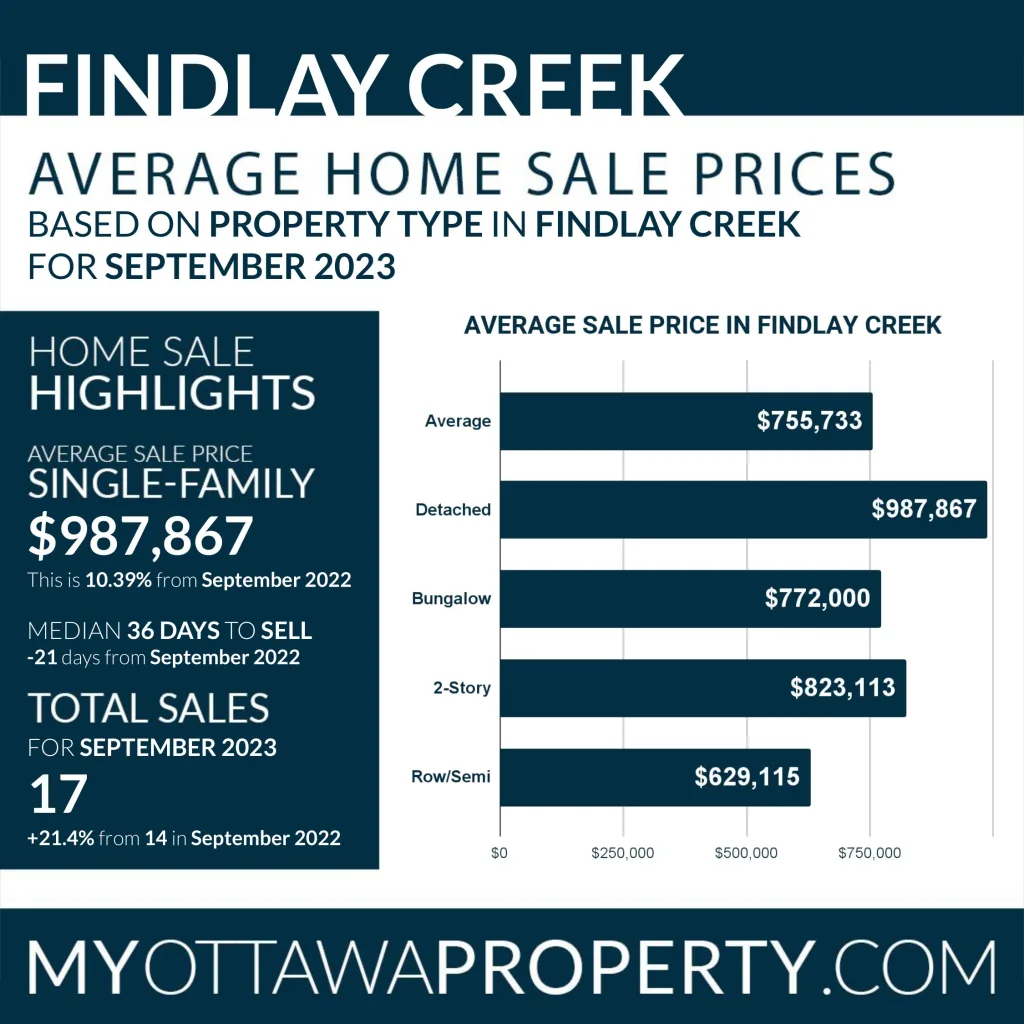
The average sale price for a detached single-family home in September 2023 for Findlay Creek has been recorded at $987,867, reflecting a 10.39% increase compared to last year’s price of $894,875 in September 2022. The steady rise in property prices showcases the desirability of the Findlay Creek housing market.
Days to Sell
The average time on the market in Findlay Creek for September was 36 days, representing a decrease of 21 days from last year in September 2022. This indicates that properties are selling faster, which can be attributed to the high demand and limited inventory in the area. Furthermore, when compared to five years ago in September 2018, the average Days to Sell has decreased by 14 days, reflecting an increasingly competitive market for buyers.
Properties Sold
In September 2023, there were 17 properties sold in Findlay Creek. This represents a 21.4% increase compared to the 14 properties sold in September 2022. However, in comparison to September 2018 when 18 properties were sold, there is a slight decrease of 5.6%. These numbers indicate a relatively stable market with steady sales activity.
Long-Term Market Growth
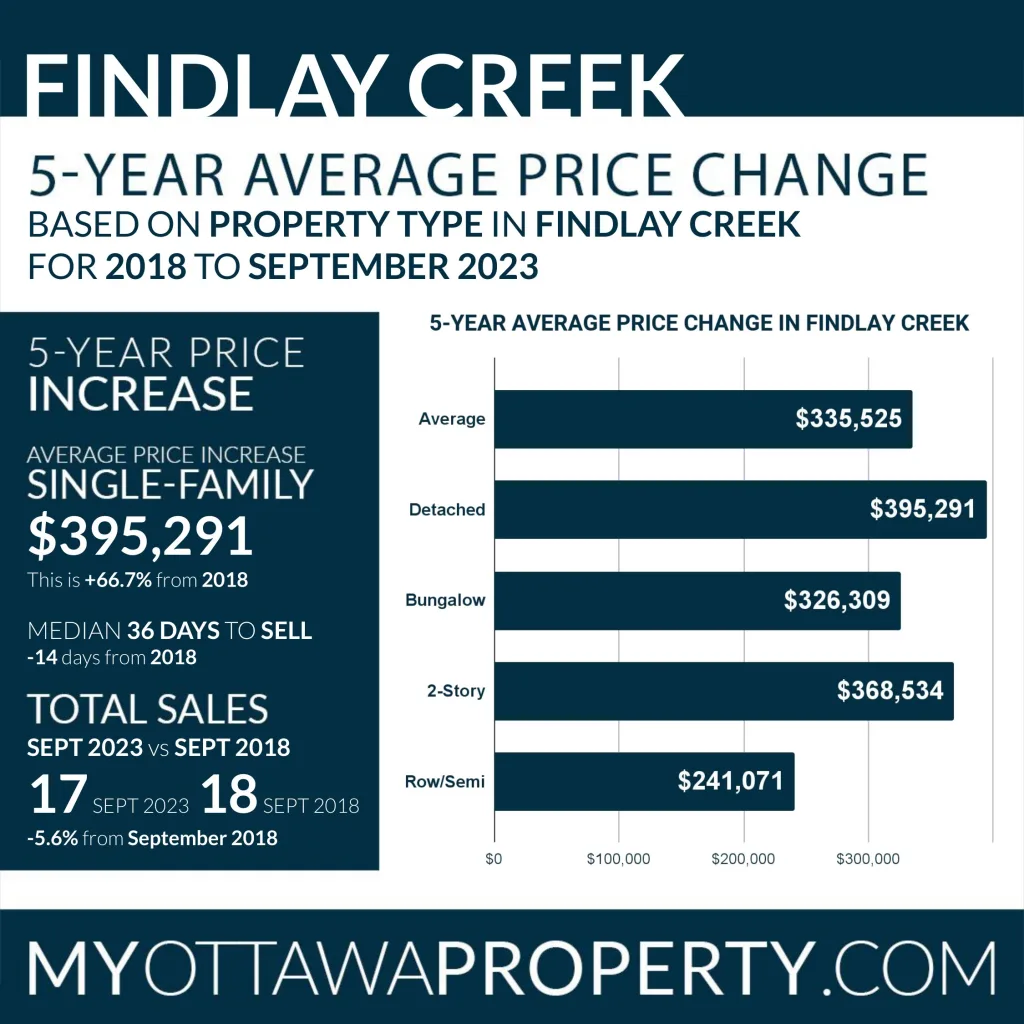
Over the past five years, the average sale prices for detached single-family homes in Findlay Creek have experienced significant growth. In 2018, the average sale price was $395,291, while in September 2023, it reached $987,867. This reflects a remarkable increase of 149.91% in property prices, demonstrating the strong market appreciation in Findlay Creek.
Property Type Comparison
When examining the average sales price changes for different property types from 2018 to September 2023, we see positive growth across the board. The average sales price for a detached single-family home increased by 66.7%, bungalows saw a growth of 73.2%, two-story homes experienced an 81.1% increase, and row/townhomes recorded a 62.1% rise in average sales price. This highlights the consistent growth and value appreciation across various property types in Findlay Creek.
Findlay Creek vs Ottawa
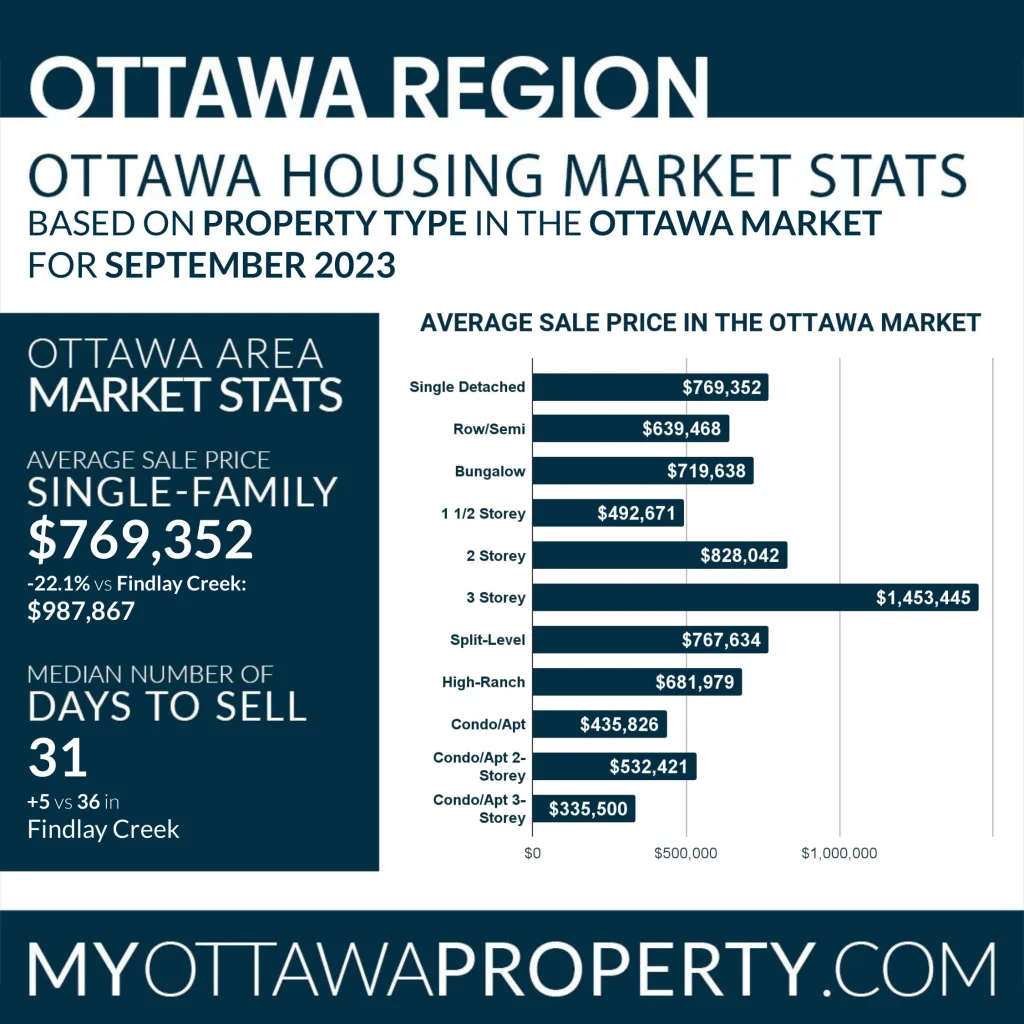
Comparing Findlay Creek to the broader municipality of Ottawa, we observe interesting trends. In September 2023, the average sale price for a detached single-family home in Ottawa was approximately $769,352, which is 22.1% lower than Findlay Creek’s average single-family home price of $987,867. This indicates that Findlay Creek offers a higher average price point, potentially due to factors such as desirable location, amenities, and the overall appeal of the community.
Posted Mortgage Rates
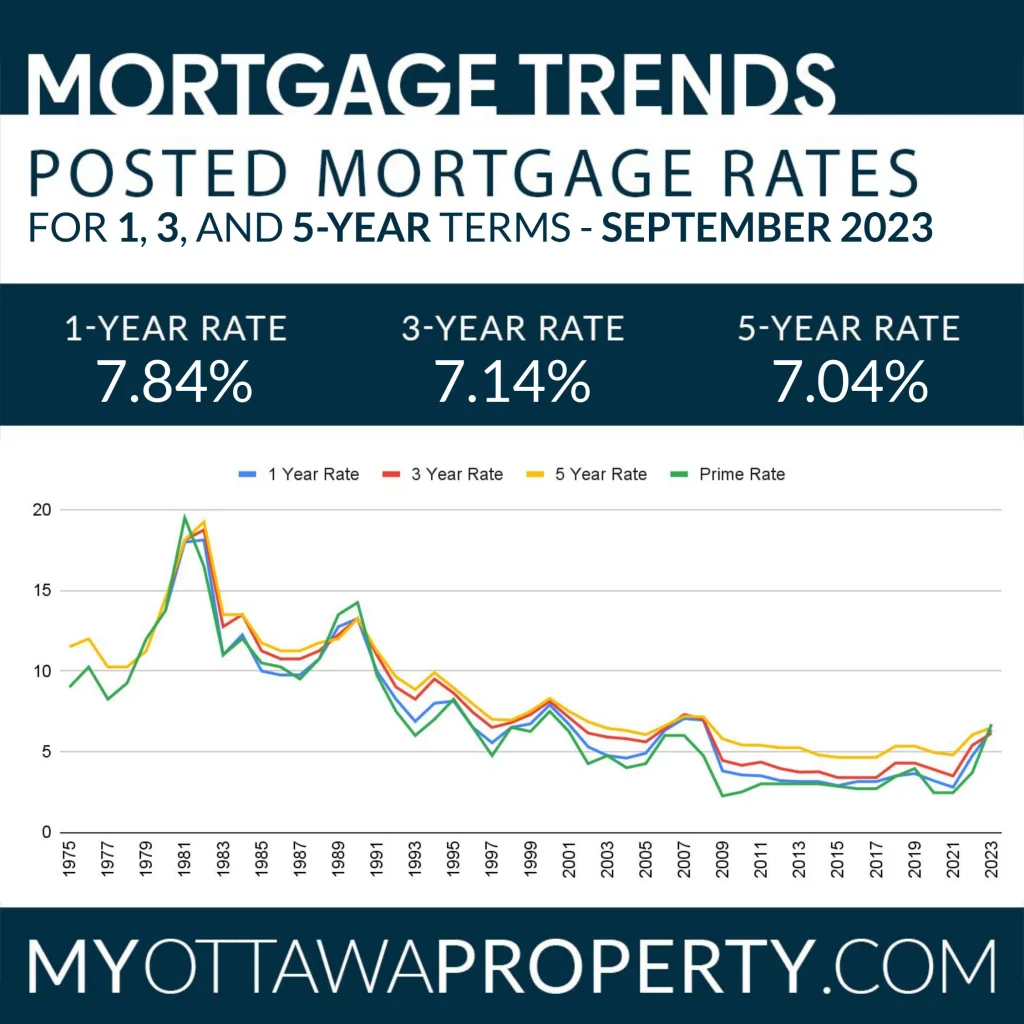
As of October 4, 2023, the interest rates for mortgage terms in Findlay Creek are as follows: 1-Year term – 7.84%, 3-Year term – 7.14%, and 5-Year term – 7.04%. These rates are subject to change and should be considered when making purchasing decisions.
Conclusion
Findlay Creek’s real estate market continues to show positive growth, with property prices steadily increasing and relatively quick sales. The rise in average sales prices across different property types highlights the overall desirability and strong value appreciation in the area. Furthermore, when compared to Ottawa as a whole, Findlay Creek offers a higher average sale price for detached single-family homes. It is important to consider current mortgage rates when planning to invest in the Findlay Creek real estate market.

All real estate statistics have been obtained from data reported by the Ottawa Real Estate Board’s MLS System. We have curated our search criteria to ensure more accurate stats for smaller regions of Ottawa. All figures are believed accurate but may not be guaranteed – we are human after all