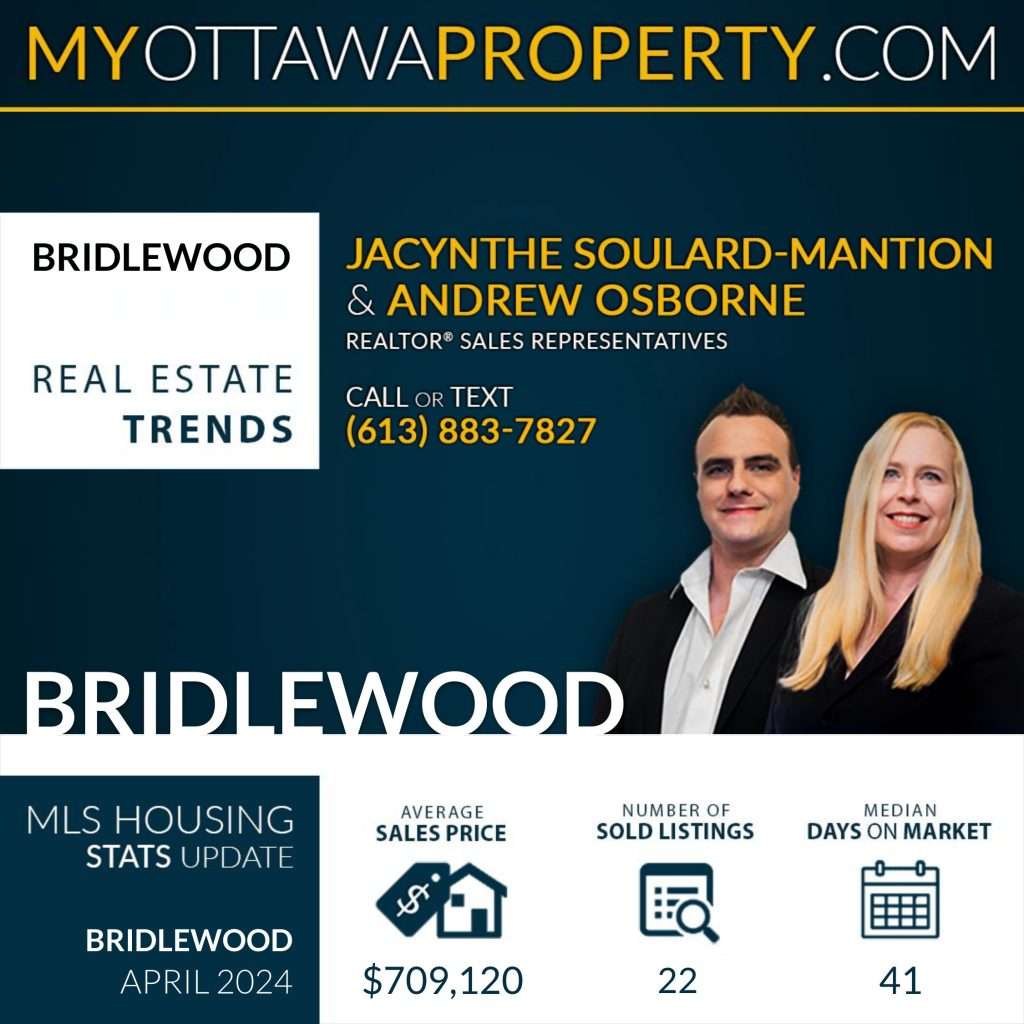
Welcome to all Bridlewood residents and real estate enthusiasts! We’re thrilled to present the latest Bridlewood real estate market report for April 2024. In this month’s report, we delve into the key statistics that will keep you informed about the current state of the unique housing market in Bridlewood.
Property Prices
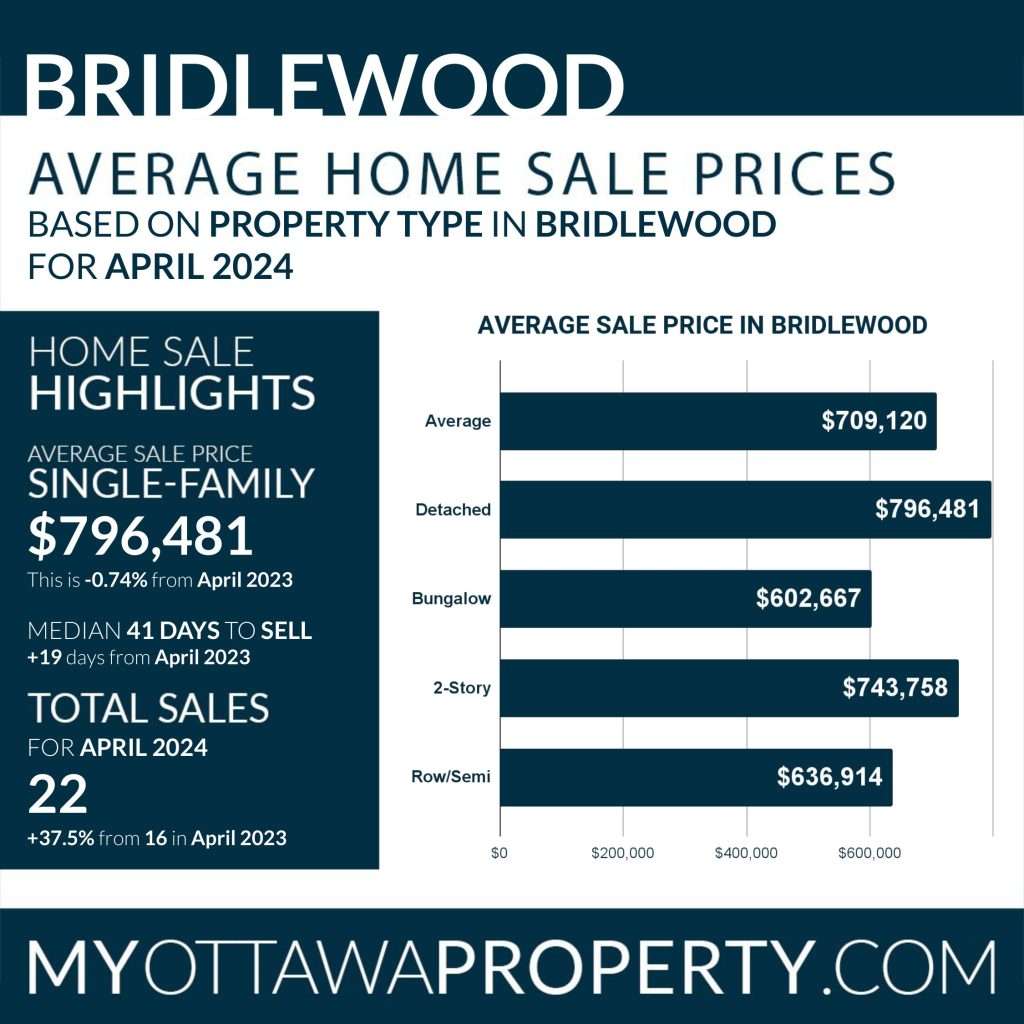
The real estate market in Bridlewood has a dynamic trend. The average sale price for a detached single-family home in April 2024 for Bridlewood has been recorded at $796,481, which reflects -0.74% compared to last year’s price of $802,389 for April 2023.
Days to Sell
When it comes to selling speed, the average time on the market in Bridlewood for April was 41 days, representing +19 days from last year in April 2023. The average Days to Sell in April 2024 was 41. Compared to 5 years ago in April 2019, where the average Days to Sell was 21, this showcases a difference of +20 days.
Properties Sold
Moving to the sale statistics, in April 2024 there were 22 properties sold in Bridlewood. Last year, in April 2024, there were 16 properties sold, showing a positive change of +37.5%. However, 5 years ago, in April 2019, there were 38 properties sold, which is a difference of -42.1% from April 2024.
Long-Term Market Growth
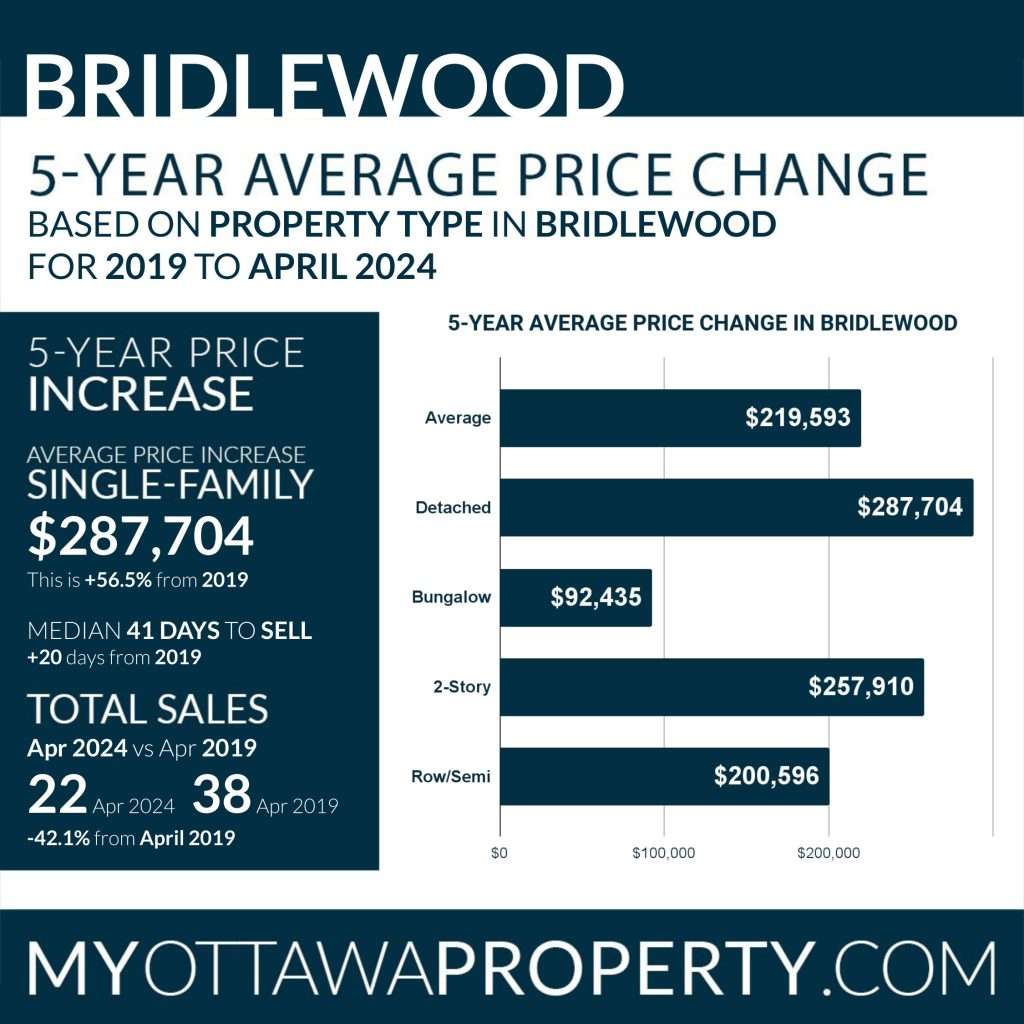
Examining the long-term perspective, in the last 5 years, sale prices for detached homes in Bridlewood have escalated from an average of $508,776 in 2019 to the current average sales price of $796,481 in April 2024. This reflects an average difference of +3.5% representing an average equity increase of approximately $287,704 for detached single-family homes in Bridlewood.
Further breaking down this growth, the average sales price change for a Bungalow from 2019 to April 2024 is $92,435, showcasing a difference of +18.1%. The average sales price change for a 2-Story home from 2019 to April 2024 amounts to $257,910, a leap of +53.1%. Additionally, the average sales price change for a Row/Town home from 2019 to April 2024 stands at $200,596, showing a jump of +46.0%.
Bridlewood vs Ottawa
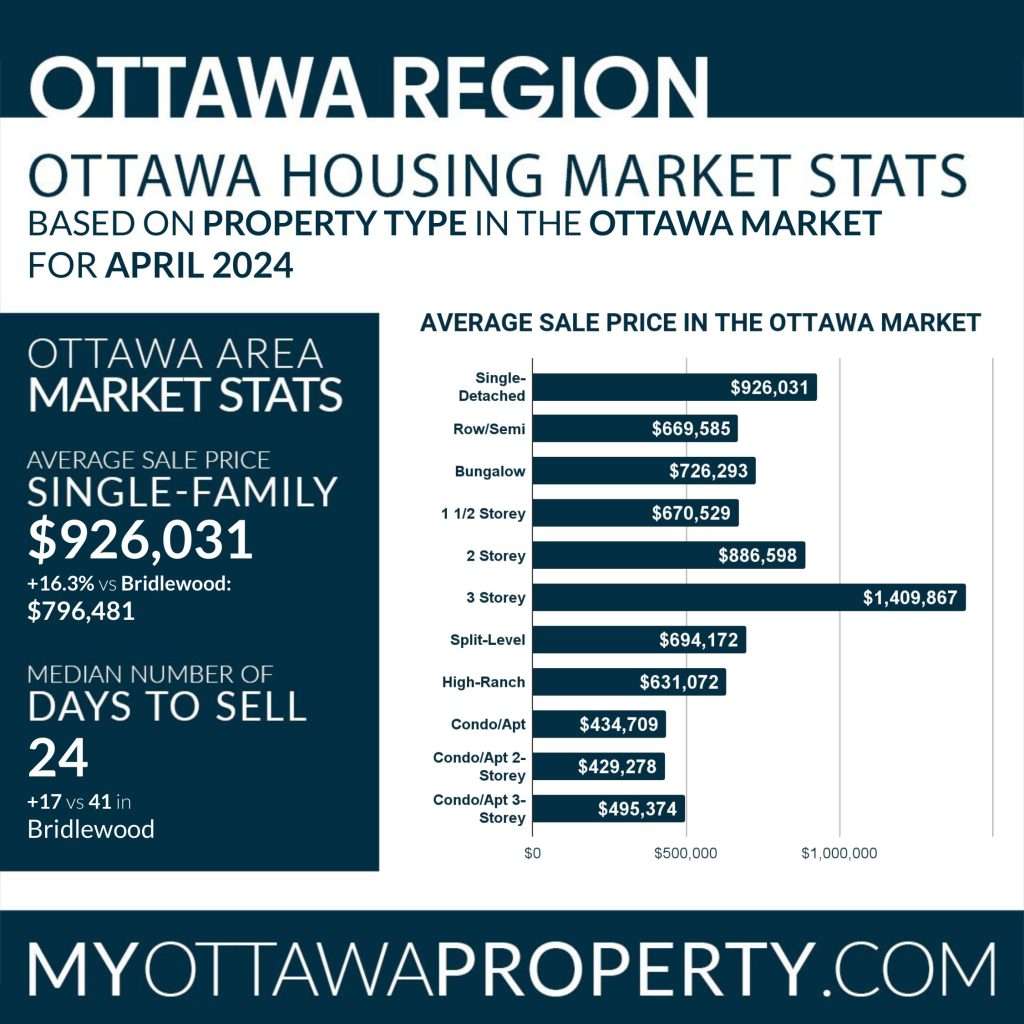
Comparing Bridlewood to the broader municipality of Ottawa, we find fascinating trends emerging. In April 2024 the average sale price for a detached single-family home in the municipality of Ottawa was around $926,031. This is +16.3% compared to Bridlewood’s average single-family home price of $796,481.
Posted Mortgage Rates
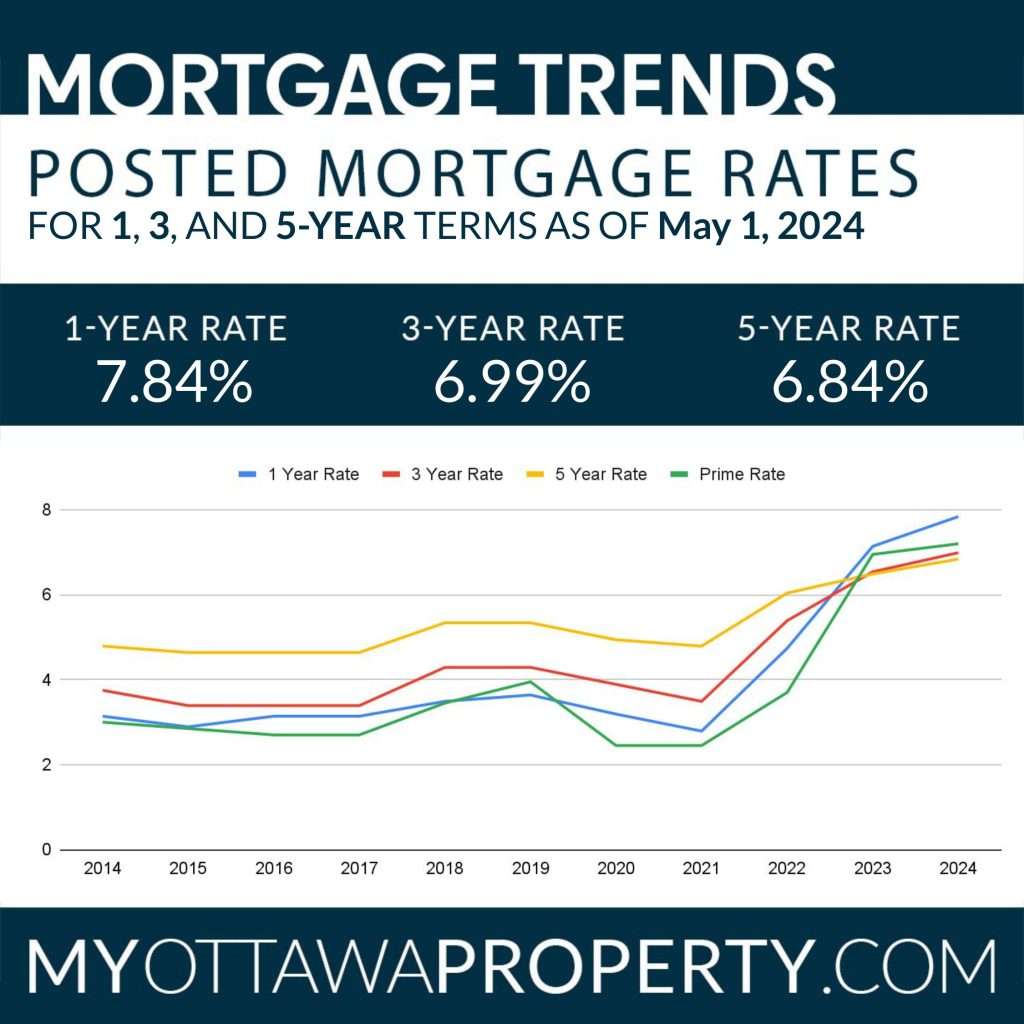
Taking into account the mortgage rates, as of May 1, 2024, the interest rates for a 1-Year term is 7.84%, the 3-Year term is 6.99%, and the 5-Year term is 6.84%.
Conclusion
As we wrap up this comprehensive overview of Bridlewood’s real estate market for April 2024, it’s clear that while the market shows some fluctuations, the long-term growth remains strong. The slight dip in property prices compared to last year should be viewed within the broader context of substantial gains over the past five years. With a slower turnover of properties and a substantial increase in the average price over the long term, Bridlewood continues to offer solid opportunities for homeowners and investors alike. Despite the market’s cooling period, the sales figures and mortgage rates indicate a resilient market that could rebound with economic shifts. For residents and potential buyers in Bridlewood, staying informed will be key to navigating this dynamic market landscape effectively.

All real estate statistics have been obtained from data reported by the Ottawa Real Estate Board’s MLS System. We have curated our search criteria to ensure more accurate stats for smaller regions of Ottawa. All figures are believed accurate but may not be guaranteed – we are human after all!